GCC’s -O3 Can Transform Performance
There’s a lot of untapped potential when compiling packages with -O2, as -O3 can have a remarkable impact on the
performance of some packages. Most traditional distros compile with fairly conservative default compiler flags so leave
plenty of performance opportunities on the table. We take a look at the performance changes when compiling packages with
all combinations of the psABI levels and -O2/3. There are some drawbacks to -O3 such as increased file sizes and
regressions for some code bases, but is surely worth it where it improves performance.
We also check out the impact of switching to x86-64-v2 and x86-64-v3 without any other flag changesof x86-64-v3.
There’s a lot of tables, so feel free to skip to the charts at the end if you’re only after an overview.
What Are we Measuring?
The previous benchmarks were intended
to highlight the difference compiling with x86-64-v3 makes. By the end it was apparent that CachyOS using -O3 was
having a large impact on the results and more so than using x86-64-v3.
Testing is performed in an arch-chroot as before but with six sets of packages installed prior to each run (including
the x86-64 -O2 run which should match the default). This includes all the packages directly used in the tests as well
as glibc and ensures an identical process is followed for each as some packages haven’t been rebuilt in Arch Linux for
some time, therefore using an older compiler or before LTO (and other flag changes) were the default. Also the
scaling_governor is set to performance to minimize fluctuations between runs and a newer kernel. Therefore the results
are not intended to be compared to the previous article.
The full list of rebuilt PKGBUILDS is bzip2, flac, gawk, glibc, gzip, libogg, libopusenc, libvorbis, lz4, opus,
opus-tools, python, vorbis-tools, xz and zstd. The r benchmark was dropped as it spent too long in blas code to give
meaningful results.
Methodology
The tests themselves are fairly basic and accessible via benchmarking-tools. There are two variations on the testing, time to complete and measuring the power consumption using RAPL.
Results
All benchmarks are measured with time (seconds except pybench which is ms), so lower is better (or minus percentages
mean the packages are faster or use less power). Power is measured in watts. The columns show the result and power use
for each architecture and the second row shows the same results but with the packages compiled at -O3 rather than
-O2. Percentages are standardized to -march=x86-64 -O2.
bzip2
| Compress Kernel (-3) | x86-64 – Time | Power | x86-64-v2 – Time | Power | x86-64-v3 – Time | Power |
|---|---|---|---|---|---|---|
| -O2 | 46.76 | 684.8 | 0.3% | -0.9% | -2% | -1.9% |
| -O3 | 0.1% | -0.4% | 0.2% | -0.9% | -1.9% | -2.1% |
| Compress Kernel (-9) | x86-64 – Time | Power | x86-64-v2 – Time | Power | x86-64-v3 – Time | Power |
|---|---|---|---|---|---|---|
| -O2 | 49.38 | 728.1 | 0.5% | -0.8% | -1.3% | -2.6% |
| -O3 | 0.3% | -0.2% | 0.7% | -0.3% | -1.4% | -1.9% |
| Decompress Kernel | x86-64 – Time | Power | x86-64-v2 – Time | Power | x86-64-v3 – Time | Power |
|---|---|---|---|---|---|---|
| -O2 | 15.29 | 234.2 | -0.1% | -2.2% | 4.8% | 4% |
| -O3 | 1.7% | -2.8% | 1.9% | -2.2% | 5.3% | 2.2% |
Optimization hasn’t really helped bzip2 performance. x86-64-v3 increases compression performance slightly, but hurts
decompression speed. x86-64-v2 brings a slight reduction in power consumed, but at a small performance cost.
flac
| Decode | x86-64 – Time | Power | x86-64-v2 – Time | Power | x86-64-v3 – Time | Power |
|---|---|---|---|---|---|---|
| -O2 | 0.72 | 10.4 | -0.1% | 0.2% | -8.5% | -7.4% |
| -O3 | -0.3% | 0.9% | -1.7% | -1.3% | -9.2% | -9.3% |
| Encode (-3) | x86-64 – Time | Power | x86-64-v2 – Time | Power | x86-64-v3 – Time | Power |
|---|---|---|---|---|---|---|
| -O2 | 0.93 | 13.5 | -2.3% | -1.4% | -6.1% | -2% |
| -O3 | -13.1% | -10.5% | -17% | -16.6% | -16.7% | -14.3% |
| Encode (-8) | x86-64 – Time | Power | x86-64-v2 – Time | Power | x86-64-v3 – Time | Power |
|---|---|---|---|---|---|---|
| -O2 | 2.98 | 47.9 | -1% | -0.6% | -5.8% | -5.4% |
| -O3 | -20.7% | -22.8% | -22% | -24.1% | -22.3% | -23.6% |
flac sees some gains from increasing the psABI level, but the performance improvements from using -O3 far exceed
these benefits. In fact, compiling with -O3 virtually removes the gains to encoding speed from using x86-64-v3
altogether, but remains important for decoding performance of flac files.
gawk
| Gawk | x86-64 – Time | Power | x86-64-v2 – Time | Power | x86-64-v3 – Time | Power |
|---|---|---|---|---|---|---|
| -O2 | 2.98 | 44.4 | -3.1% | -3.1% | -0.7% | 0.2% |
| -O3 | -4.4% | -4.9% | -6% | -8% | -3% | -2.8% |
Here we have an interesting case where upping the optimizations to x86-64-v2 provides a nice performance win, but
evaporates when increasing the level further to x86-64-v3. We see -O3 again provide an additional benefit at all
psABI levels.
gzip
| Compress Kernel (-3) | x86-64 – Time | Power | x86-64-v2 – Time | Power | x86-64-v3 – Time | Power |
|---|---|---|---|---|---|---|
| -O2 | 9.48 | 139.5 | 0% | -0.3% | -1.1% | -2.3% |
| -O3 | -0.3% | -1.1% | 0.6% | -1.2% | 1% | 0% |
| Compress Kernel (-9) | x86-64 – Time | Power | x86-64-v2 – Time | Power | x86-64-v3 – Time | Power |
|---|---|---|---|---|---|---|
| -O2 | 34.49 | 490 | 0.3% | -0.2% | 0% | -0.1% |
| -O3 | -0.7% | -1.2% | -0.4% | -1.1% | -0.7% | -1.1% |
| Decompress Kernel | x86-64 – Time | Power | x86-64-v2 – Time | Power | x86-64-v3 – Time | Power |
|---|---|---|---|---|---|---|
| -O2 | 3.47 | 49.6 | 2.4% | 0.8% | -2.5% | -3% |
| -O3 | 0.1% | -2% | -0.4% | -3.3% | -0.5% | -2% |
To highlight why the numbers aren’t comparable to the previous tests, rebuilding gzip even with --march=x86-64 (the
Arch Linux build date is 2022-04-07 17:33 UTC) has improved its performance a lot! So when the previous post showed 10%
wins…that wasn’t even due to the higher optimization level, but the new compiler and flags that have been integrated
in the last 9 months. This also highlights the benefit of rebuilding packages that haven’t been for some time.
Optimizations have not had major impact on the gzip package outside of a small benefit of x86-64-v3 for
decompression.
lz4
| Compress Kernel (–best) | x86-64 – Time | Power | x86-64-v2 – Time | Power | x86-64-v3 – Time | Power |
|---|---|---|---|---|---|---|
| -O2 | 44.24 | 642.9 | 5.8% | 9.4% | 2.9% | 1.1% |
| -O3 | 1.4% | 0.3% | 13.2% | 11.5% | -0.5% | 4% |
| Compress Kernel (-5) | x86-64 – Time | Power | x86-64-v2 – Time | Power | x86-64-v3 – Time | Power |
|---|---|---|---|---|---|---|
| -O2 | 9.88 | 142.2 | -0.9% | 0.2% | 1.9% | 2.3% |
| -O3 | 1.5% | 2% | 0.9% | 0.4% | 2.6% | 8.7% |
| Decompress Kernel | x86-64 – Time | Power | x86-64-v2 – Time | Power | x86-64-v3 – Time | Power |
|---|---|---|---|---|---|---|
| -O2 | 0.72 | 12.1 | -6.5% | -7.5% | -5.7% | -5.6% |
| -O3 | -1.7% | -3.6% | -9.1% | -10.2% | -9.1% | -9.9% |
The lz4 results really mess with your head! -O3 and increasing psABI levels have typically made compression slower,
but a major benefit for decompression. The x86-64-v2 results for --best compression are truly awful and a real
outlier of the testing (the standard deviation was relatively low and the tests before and after had typical
performance. The -O2 and -O3 results were also done hours apart).
x86-64-v3 combined with -O3 was showing spikes in power consumed in the compression tests.
Perhaps there’s potential to add -O3 to only parts of the code, though such things would be better handled upstream by
the build system. Alternatively the use of PGO may get the same result, though most distribution build systems lack
features for making PGO easy to add to a build.
opus
| Decode | x86-64 – Time | Power | x86-64-v2 – Time | Power | x86-64-v3 – Time | Power |
|---|---|---|---|---|---|---|
| -O2 | 3.2 | 49.1 | -1.4% | -1.3% | -6.5% | -6.3% |
| -O3 | -1.7% | -1.9% | -3.1% | -3.4% | -8.2% | -6.5% |
| Encode (128 kbit/s) | x86-64 – Time | Power | x86-64-v2 – Time | Power | x86-64-v3 – Time | Power |
|---|---|---|---|---|---|---|
| -O2 | 5.91 | 88 | -2.6% | -2.5% | -9.9% | -9.8% |
| -O3 | -3.5% | -4% | -6% | -6.4% | -13.4% | -13.3% |
| Encode (256 kbit/s) | x86-64 – Time | Power | x86-64-v2 – Time | Power | x86-64-v3 – Time | Power |
|---|---|---|---|---|---|---|
| -O2 | 6.71 | 100.2 | -2.6% | -2.6% | -9.2% | -9.9% |
| -O3 | -2.1% | -3% | -4.9% | -5.1% | -11.4% | -11.3% |
A new benchmark was added since the last post with the first contribution
to benchmarking-tools (YAY!). opus follows the norm that more optimizations bring more performance. x86-64-v3 was
particularly impactful with -O3 being a welcome improvement on top.
python
| Pybench | x86-64 – Time | Power | x86-64-v2 – Time | Power | x86-64-v3 – Time | Power |
|---|---|---|---|---|---|---|
| -O2 | 1444.67 | 283.9 | -1.1% | -2% | 3.8% | 3.4% |
| -O3 | 0.1% | -0.5% | -1.3% | -2.1% | 1.3% | -0.6% |
Here we have another result where x86-64-v2 shows the greatest gains compared to the regression with x86-64-v3. It’s
important to realize that AVX2 isn’t always a benefit for all workloads.
vorbis
| Decode | x86-64 – Time | Power | x86-64-v2 – Time | Power | x86-64-v3 – Time | Power |
|---|---|---|---|---|---|---|
| -O2 | 2.27 | 34.3 | 0.5% | 0.3% | -1.5% | -1.3% |
| -O3 | -4.8% | -4.5% | -5.4% | -5.6% | -14% | -13.1% |
| Encode (-b 128) | x86-64 – Time | Power | x86-64-v2 – Time | Power | x86-64-v3 – Time | Power |
|---|---|---|---|---|---|---|
| -O2 | 6.39 | 96.9 | -0.7% | -1.1% | -5.3% | -5% |
| -O3 | -6% | -5.9% | -8.9% | -9.5% | -18% | -16% |
| Encode (-q 10) | x86-64 – Time | Power | x86-64-v2 – Time | Power | x86-64-v3 – Time | Power |
|---|---|---|---|---|---|---|
| -O2 | 8.33 | 126.6 | -0.7% | -1.9% | -4.5% | -4.9% |
| -O3 | -3.7% | -3.6% | -6.3% | -6.5% | -11.3% | -9.4% |
The other major result from the previous post was vorbis and we again see (like with flac) that compiling with -O3
is largely responsible for the big gains seen. Though x86-64-v3 brings a 5% performance benefit to encoding ogg files
on top of that. Here we see -O3 being a universal performance improvement.
xz
| Compress Kernel (-3 -T1) | x86-64 – Time | Power | x86-64-v2 – Time | Power | x86-64-v3 – Time | Power |
|---|---|---|---|---|---|---|
| -O2 | 75.54 | 1142 | -0.7% | -1.1% | -0.1% | 0.9% |
| -O3 | 0.2% | -0.6% | -0.2% | 0.3% | -0.9% | -1.6% |
| Compress Kernel (-9 -T4) | x86-64 – Time | Power | x86-64-v2 – Time | Power | x86-64-v3 – Time | Power |
|---|---|---|---|---|---|---|
| -O2 | 95.73 | 2629 | -0.3% | -0.4% | 1.2% | 0.3% |
| -O3 | 1.6% | 2.7% | 1.9% | 2.8% | 2.9% | 10.4% |
| Decompress Kernel | x86-64 – Time | Power | x86-64-v2 – Time | Power | x86-64-v3 – Time | Power |
|---|---|---|---|---|---|---|
| -O2 | 5.8 | 88 | -0.7% | 0.1% | -1.3% | -1.2% |
| -O3 | -2.2% | -1.7% | 0.7% | 1% | -1.6% | -0.8% |
xz provides another case where optimization is generally not that beneficial. Though here we see a breakdown of the
massive power increase from the Compress Kernel (-9 -T4) benchmark. It is not the use of x86-64-v3 causing the
increase, but the combination with -O3. Quite interesting!
zstd
| Compress Kernel (-19 -T4) | x86-64 – Time | Power | x86-64-v2 – Time | Power | x86-64-v3 – Time | Power |
|---|---|---|---|---|---|---|
| -O2 | 76.07 | 2392 | -0.6% | -0.7% | -1.2% | 8.1% |
| -O3 | 1.2% | 2.3% | 0.9% | 2.4% | -0.1% | -0.3% |
| Compress Kernel (-8 -T1) | x86-64 – Time | Power | x86-64-v2 – Time | Power | x86-64-v3 – Time | Power |
|---|---|---|---|---|---|---|
| -O2 | 11.07 | 179.5 | 2.5% | 2.9% | -2.2% | -1.4% |
| -O3 | -0.3% | -0.8% | 0.6% | 0.2% | -2.6% | -2.4% |
| Decompress Kernel | x86-64 – Time | Power | x86-64-v2 – Time | Power | x86-64-v3 – Time | Power |
|---|---|---|---|---|---|---|
| -O2 | 0.99 | 16.3 | -0.3% | 0.1% | -2.6% | -3% |
| -O3 | -0.2% | -0.3% | 0% | -0.3% | 3.4% | 5.2% |
zstd shows just how fiddly optimization can be. Depending on the psABI level, building with -O3 can do very little,
provide a small improvement to performance or a sizable regression. This highlights the importance of testing as the
wrong combination of flags can hurt performance. We see a large increase in power consumption when using x86-64-v3
with multi-threaded compression, though it disappeared when also compiling with -O3 (the opposite of xz).
x86-64-v2 May Not Provide Enough Gains
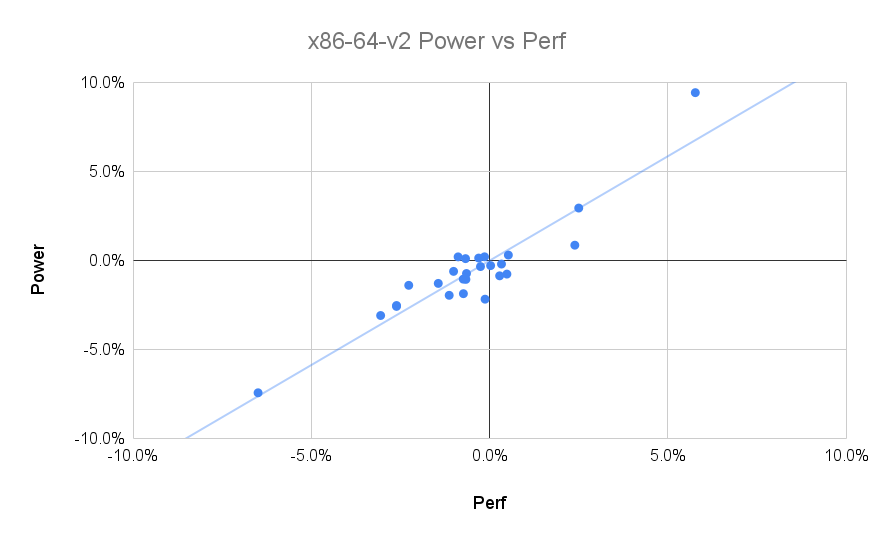
x86-64-v2 brings advantages such as SSE4.2, without any of the drawbacks of combining SSE and AVX code together.
However, while bringing some consistent (but small) improvements, the three regressions really stand out! Ironically, it
was lz4 that brought the largest improvement and the biggest regression.
x86-64-v3 Provides a Nice Boost, But With Regressions
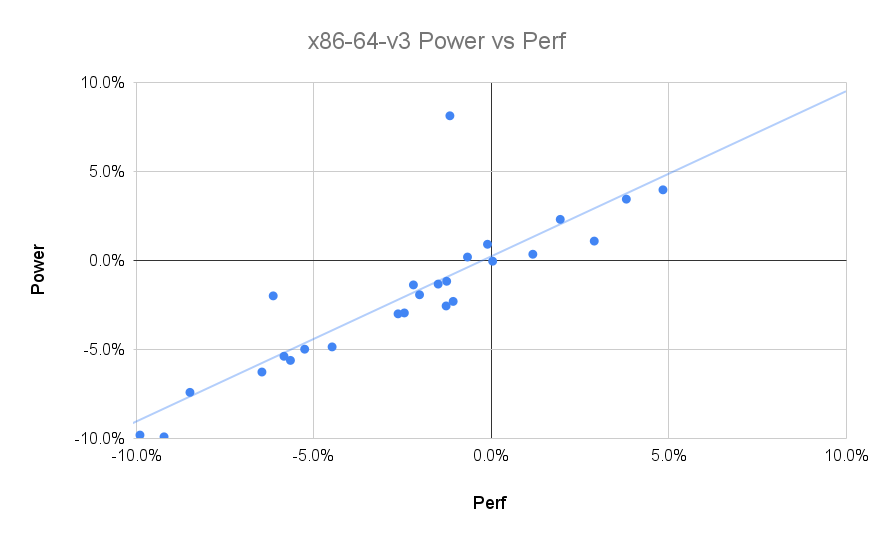
Adding newer CPU instructions to your packages can bring nice improvements and we see good value from them here. The results are much more scattered, but favouring performance. There were a couple of results that were some way above the line indicating that it could also lead to increased power use.
Has GCC Got The Levels Right?
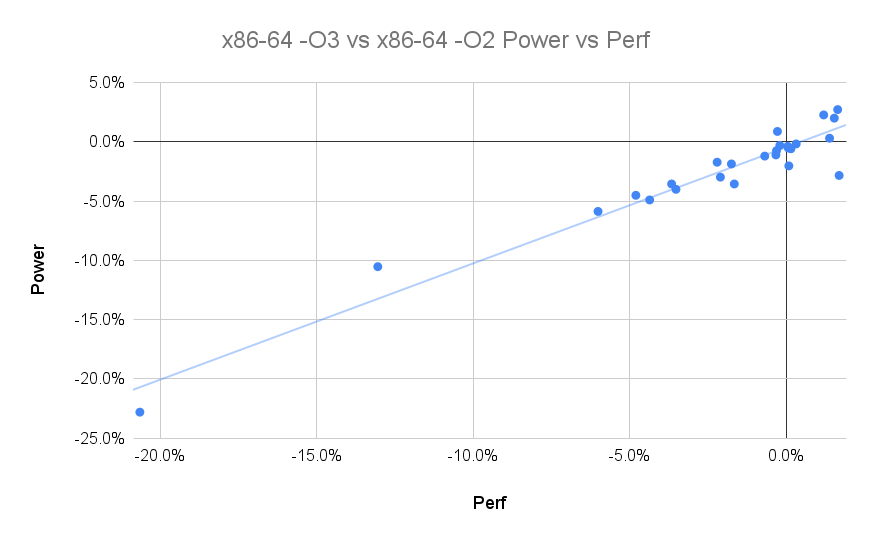
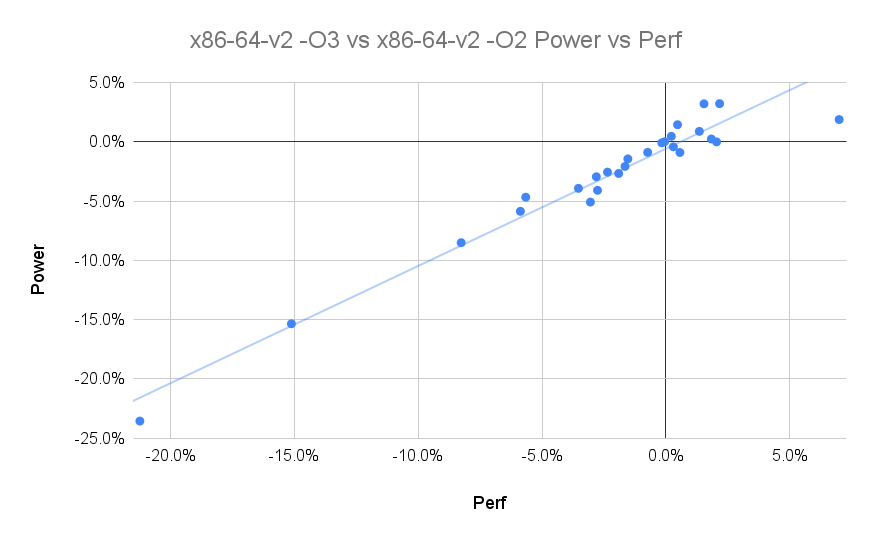
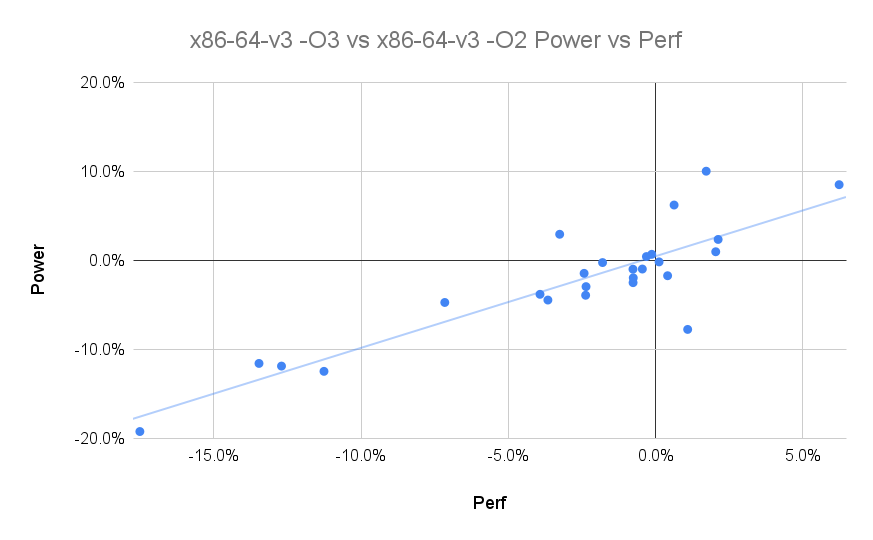
Here the charts show the improvement at each psABI level from switching from -O2 to -O3. -O3 brings some huge
improvements at all levels. There were some small regressions at all levels, but psABI levels v2 and v3 produced a
single large regression on top of the smaller ones.
In GCC 12, vectorization was finally added to the -O2 level, but only the equivalent of -fvect-cost-model=very-cheap.
This severely limits where vectorization will occur with the -O3 level setting fvect-cost-model=dynamic. Does this
mean that -O2 is incorrectly tuned? There’s potential that this can be improved upon and possibly what I’ll look at
next.
The Cost Of -O3
There are some downsides to compiling with -O3, for example the size of the flac library increases by 33%, the
vorbis library by 40% and the opus library by over 50%! It’s not all bad though, as the total increase in the
installed size of the packages was just under 2.5MB (though most of the built binary packages were quite small). It’s
also not a benefit for all packages with some visible regressions.
Challenges For Distribution Optimization?
We need some flexibility from distributions to adjust the default flags in situations where there’s a large performance improvement. Adding performance testing to QA would go a great way to ensuring that packages become and remain fast.
Performance Guided Optimizations (PGO) may help situations where -O3 is both a performance improvement and a
regression. This can also overcome arcane distribution rules where altering flags is problematic. There are few
distribution build systems that make it easy to add PGO to packages. This is pretty disappointing given how simple the
process is and the benefits it can bring.